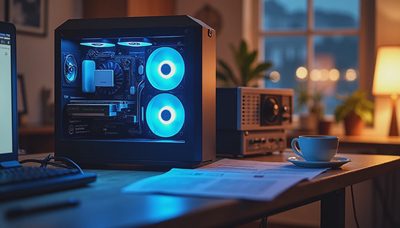

I used to blame the diffusion model for every out-of-memory error.
It is the biggest file. It is the stage that feels the most expensive. When the 3090 hit the ceiling I would immediately reach for quantization or offloading and assume the weights were the problem. Sometimes they were. Often they were not.
After enough evenings of watching the VRAM graph climb at unexpected moments, I started isolating nodes one at a time. The results were not always intuitive. Some lightweight-looking nodes allocated large temporary buffers. Some model loaders held more memory than their file size suggested. Some decode settings caused spikes that only appeared at certain resolutions or frame counts.
This post is the practical method I now use to answer a simple question: which node is actually using all your VRAM? It is written from the perspective of a 24 GB RTX 3090 running Wan2.2 in ComfyUI, but the approach works on any consumer card.
If you can’t reproduce it, it’s not a workflow. Memory attribution is part of reproducibility.
Why “The Model Is Big” Is Not Enough
Model weight size is only one component of peak VRAM. During a real run you also pay for:
Activations during sampling (scale with resolution and frame count)
Intermediate latents
Temporary buffers inside individual nodes
Decoded frames if they are kept in memory
ComfyUI overhead and any custom nodes that allocate on load
A workflow can OOM even when the weights alone would fit, because the peak happens in a different stage. Conversely, a heavy model can run comfortably if the rest of the graph is lean and the sequence is short.
Guessing which part is responsible wastes time. Measurement is faster.
The Isolation Method I Use
I treat VRAM diagnosis like any other controlled experiment. One variable at a time, everything else frozen.
Step 1: Establish a Clean Baseline Peak
Run the full minimal graph with the exact settings you care about (resolution, frame count, precision, seed). Record the peak VRAM reported by your monitoring tool. This is the number you are trying to explain.
Step 2: Disable or Bypass Stages Systematically
I work roughly in reverse order of the five-stage map:
Replace the final video save with a no-op or a lightweight preview if needed.
Bypass or simplify the VAE decode. Compare peak with and without full decode.
Reduce frame count to the minimum that still exercises the sampler. Note the difference.
Swap to a tiny test latent or a shorter sampling run if the graph allows it.
Finally, look at the loaders themselves.
Each time I change only one thing and re-measure the peak on a cold run. Cold runs matter; warm runs can hide allocations that occur on first load.
Step 3: Watch When the Graph Climbs
Timing information is useful. If VRAM jumps hard during model load and then stays flat, the loaders are the main cost. If it climbs steadily during sampling, activations and frame count dominate. If it spikes only at the end, decode or frame assembly is the culprit.
On the 3090 I have seen all three patterns depending on the graph.
Nodes That Surprised Me
VAE Decode
I repeatedly underestimated this stage. Certain VAE implementations and decode settings allocate significant temporary memory, especially at higher resolutions or when tiling is involved. A workflow that looked fine in latent space could spike hard at decode. Isolating the VAE turned several “model is too big” mysteries into “decode settings are expensive” findings.
Frame Count Controls
Frame count is not just a quality setting. It directly multiplies activation memory and latent storage. Dropping from 24 frames to 8 frames on the same graph often produced a larger VRAM reduction than swapping to a slightly smaller model variant. This is why I treat frame count as a first-class cost in every baseline.
Helper and Convenience Nodes
Automatic resolution calculators, prompt template nodes, and certain preview nodes can allocate more than their UI presence suggests. I have seen “harmless” helper nodes add hundreds of megabytes that only become visible when the rest of the graph is already near the ceiling.
Multiple Model Loaders
Loading the diffusion model, text encoder, and VAE is necessary. Loading extra unused models or keeping multiple precision versions resident is not. Orphaned loaders left over from earlier experiments are a common source of silent overhead.
Practical Tools on the 3090
I use a simple combination:
System/GPU monitoring that shows peak and current usage
Cold launches of ComfyUI for every serious measurement
A minimal graph version of the workflow under test
A short written log: resolution, frame count, which node was changed, peak VRAM observed
I do not rely on a single screenshot of the VRAM graph. I rely on repeated measurements under controlled conditions.
A Short Diagnostic Checklist

Record peak VRAM on the full run you care about.
Reduce frame count dramatically and re-measure.
Bypass or simplify VAE decode and re-measure.
Confirm no extra models are loaded.
Remove non-essential helper nodes and re-measure.
Only then decide whether quantization or offloading is the right next tool.
This sequence usually tells me whether the problem is weights, activations, decode, or graph bloat.
What I Changed in My Own Practice
I stopped treating OOM as a single binary event. I started treating it as a signal that points to a specific stage. The 3090 is honest hardware: it will run what fits and fail what does not. My job is to know which part is pushing it over the edge so I can fix the actual cause instead of applying the same blunt workaround every time.
I also keep a “lean” version of every important workflow. The lean version is the one I use for memory diagnosis. The full version is allowed to add enhancement nodes only after the lean path is understood.
Closing
The node using all your VRAM is not always the one with the biggest file name. Sometimes it is the decode stage. Sometimes it is the frame count. Sometimes it is a helper node you stopped noticing.
The only reliable way I have found to identify it is controlled isolation on the hardware you actually use. On a 24 GB RTX 3090 that method turns vague memory anxiety into a short list of measurable facts.
Run the test. Save the settings. Show the failure.
The settings are part of the result.